实验一 Linear Regression

采用 sklearn 设计线性回归模型

导入包

1
2
3
4
5
import matplotlib.pyplot as plt
import numpy as np
from sklearn import linear_model
from sklearn.datasets import load_diabetes
from sklearn.metrics import mean_squared_error

查看数据集前三个样本

1
2
3
4
# 查看数据集前三个样本的数据
data = load_diabetes().data
labels = load_diabetes().target
print('data', data[:3, :], '\n', 'target', labels[:3])
1
2
3
4
5
6
7
data [[ 0.03807591  0.05068012  0.06169621  0.02187239 -0.0442235  -0.03482076
-0.04340085 -0.00259226 0.01990749 -0.01764613]
[-0.00188202 -0.04464164 -0.05147406 -0.02632753 -0.00844872 -0.01916334
0.07441156 -0.03949338 -0.06833155 -0.09220405]
[ 0.08529891 0.05068012 0.04445121 -0.00567042 -0.04559945 -0.03419447
-0.03235593 -0.00259226 0.00286131 -0.02593034]]
target [151. 75. 141.]

按1:9分割数据集,查看分割结果

1
2
3
4
5
6
# 按1:9分割数据集,查看分割结果
offset = int(data.shape[0] * 0.9)
X_train, y_train = data[:offset], labels[:offset].reshape((-1, 1)) # reshape(-1,1)转化为1列
X_test, y_test = data[offset:], labels[offset:].reshape((-1, 1))
print('X_train', X_train.shape, '\n', 'X_test', X_test.shape)
print('y_train', y_train.shape, '\n', 'y_test', y_test.shape)
1
2
3
4
5
 target [151.  75. 141.]
X_train (397, 10)
X_test (45, 10)
y_train (397, 1)
y_test (45, 1)

通过调用 **linear_model.LinearRegression()**方法搭建模型,调用 **fit()**方法训练模型,展示模型各项参数,并计算测试集均方误差

1
2
3
4
5
6
7
8
9
10
11
12
13
14
15
16
# 通过调用 linear_model.LinearRegression()方法搭建模型,调用 fit()方法训练模型,展示模型各项参数并计算测试集均方误差
model = linear_model.LinearRegression(fit_intercept=True, copy_X=True, n_jobs=1)
model.fit(X_train, y_train)
# fit_intercept: 是否对训练数据进行中心化
# normalize: 是否对数据进行标准化处理
# copy_X: 是否对X复制,如果选择false,则直接对原数据进行覆盖
# n_jobs: 计算时设置的任务个数

print('coefficients:', model.coef_, '\n', 'intercept:', model.intercept_, '\n', 'score:', model.score(X_test,y_test))
# conefficients:模型系数/权重 intercept:截距、偏置bias score:评估指数,越接近1越好

y_pred = model.predict(X_train)
y_pred_t = model.predict(X_test)
mse = mean_squared_error(y_pred_t, y_test)
print('MSE', mse)
# MSE: 均方误差
1
2
3
4
5
coefficients: [[-4.32267019e-01 -2.37522416e+02  5.20210764e+02  3.04171914e+02
-7.51563208e+02 4.29790050e+02 9.94674947e+01 2.14872395e+02
6.89370808e+02 9.73256066e+01]]
intercept: [152.40057362]
score: 0.6872989515490583

画出拟合曲线

1
2
3
4
5
6
7
8
9
10
11
12
13
14
# 画出拟合曲线
plt.figure(1)
plt.plot(range(X_train.shape[0]), y_train, color='blue') # 绘图
plt.plot(y_pred, color='darkorange')
plt.xlabel('x')
plt.ylabel('y')
plt.title('sklearn train')
plt.figure(2)
plt.plot(range(X_test.shape[0]), y_test, color='blue')
plt.plot(y_pred_t, color='darkorange')
plt.xlabel('x')
plt.ylabel('y')
plt.title('sklearn test')
plt.show()

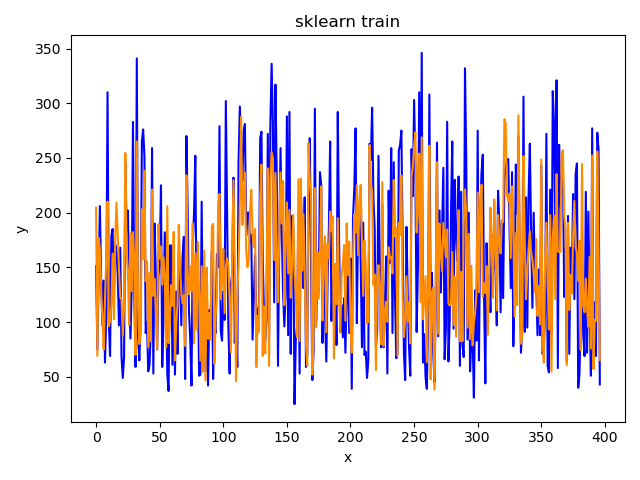
训练集拟合曲线

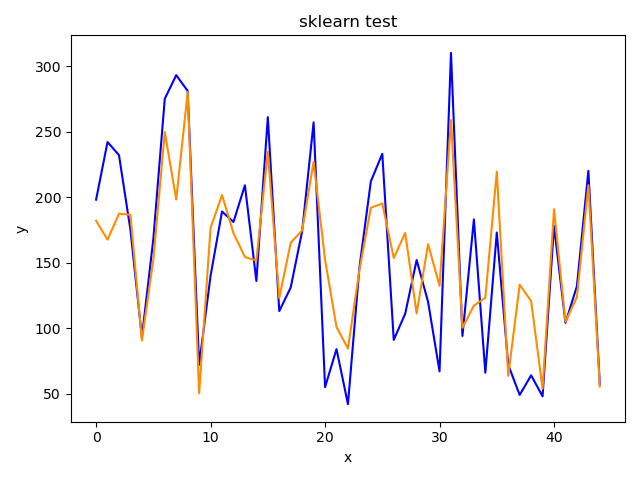
测试集拟合曲线

复现线性回归核心代码

导入包

1
2
3
import numpy as np
import matplotlib.pyplot as plt
from sklearn.datasets import load_diabetes

定义模型LinearRegression类,并在其中定义模型参数初始化函数、损失函数、训练函数和预测函数

1
2
3
4
5
6
7
8
9
10
11
12
13
14
15
16
17
18
19
20
21
22
23
24
25
26
27
28
29
30
31
32
33
34
35
36
37
38
39
40
41
42
43
44
45
46
47
48
49
50
51
52
53
54
55
56
57
58
59
60
61
62
63
64
65
66
67
class LinearRegression:
def __init__(self):
pass

def initialize_params(self, dims):
"""
初始化模型参数为0
:param dims: 数据的维度(属性个数)
:return: w,b
"""
w = np.zeros((dims, 1)) # dims行1列的矩阵,dims为特征个数
b = 0
return w, b

def linear_loss(self, X, y, w, b):
"""
定义损失函数
:param X: 数据
:param y: 标签
:param w: 权重weight
:param b: 偏置bias
:return: y_hat,loss,dw,wb:预测值,损失值梯度
"""
num_object = X.shape[0]
num_feature = X.shape[1]
y_hat = np.dot(X, w) + b # X是n*m维,w是m*1维,结果为n*1为
loss = np.sum((y_hat - y) ** 2) / num_object # 损失:均方误差MSE
dw = np.dot(X.T, (y_hat - y)) / num_object # 求W梯度向量,X.T是m*n维,y_hat-y是n*1维,结果是m*1维(和W维度一致)
db = np.sum(y_hat - y) / num_object
return y_hat, loss, dw, db

def linear_train(self, X, y, learning_rate, epoch):
"""
定义模型训练函数
:param X: 数据
:param y: 标签
:param learning_rate:学习率
:param epoch: 训练次数
:return: loss, params, grads:最终损失,参数,梯度
"""
loss_his = []
w, b = self.initialize_params(X.shape[1])
for i in range(1, epoch):
# 计算训练集当前输出、损失函数值、梯度
y_hat, loss, dw, db = self.linear_loss(X, y, w, b)
loss_his.append(loss)
# 更新参数
w += -learning_rate * dw
b += -learning_rate * db
if i % 10000 == 0:
print('epoch %d loss %f' % (i, loss))
params = {'w': w, 'b': b}
grads = {'dw': dw, 'db': db}
np.savetxt('train_loss.txt', loss_his) # 保存损失函数值
return loss, params, grads

def predict(self, X, params):
"""
定义模型预测函数
:param X: 数据
:param params: 训练得到的参数w和b
:return: 预测值
"""
w = params['w']
b = params['b']
y_pred = np.dot(X, w) + b
return y_pred

训练模型并展示损失曲线

1
2
3
4
5
6
7
8
9
10
11
12
13
14
15
16
17
18
if __name__ == '__main__':
# 训练模型并展示损失曲线
lr = LinearRegression()
X = load_diabetes().data
labels = load_diabetes().target
offset = int(X.shape[0] * 0.9)
X_train, y_train = X[:offset], labels[:offset].reshape((-1, 1))
X_test, y_test = X[offset:], labels[offset:].reshape((-1, 1)) # reshape((-1, 1)将y转换为1列
loss, params, grads = lr.linear_train(X_train, y_train, 0.4, 100000) # 训练模型

# 观察损失值随训练次数的变化
train_loss = np.loadtxt('train_loss.txt')
plt.plot(train_loss)
plt.legend(['train loss'])
plt.xlabel('epoch')
plt.ylabel('loss')
plt.savefig('train_loss.jpg')
plt.show()

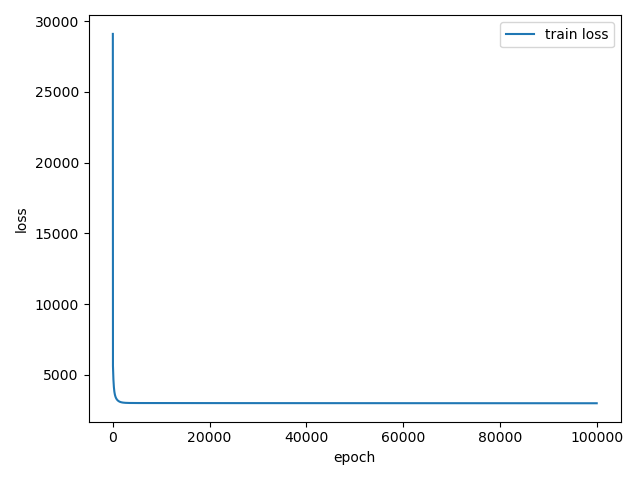
损失曲线

测试模型并展示拟合曲线

1
2
3
4
5
6
7
8
9
10
11
12
13
14
15
16
17
18
19
20
21
22
# 测试模型并展示拟合曲线
y_pred = lr.predict(X_test, params)
y_pred_train = lr.predict(X_train, params)
valid_score = 1 - (np.sum((y_test - y_pred) ** 2) / np.sum((np.mean(y_test) - y_test) ** 2)) # 计算测试集score
mse = np.sum(((y_pred - y_test) ** 2)) / len(X_test) # MSE
print('test score is', valid_score, '\n', 'mse', mse)

plt.figure(1)
plt.plot(range(X_train.shape[0]), y_train, color='blue') # 绘训练集拟合图
plt.plot(y_pred_train, color='darkorange')
plt.xlabel('x')
plt.ylabel('y')
plt.title('detail train')
plt.savefig('detail_train.jpg')
plt.figure(2)
plt.plot(range(X_test.shape[0]), y_test, color='blue') # 绘测试集拟合图
plt.plot(y_pred, color='darkorange')
plt.xlabel('x')
plt.ylabel('y')
plt.title('detail test')
plt.savefig('detail_test.jpg')
plt.show()

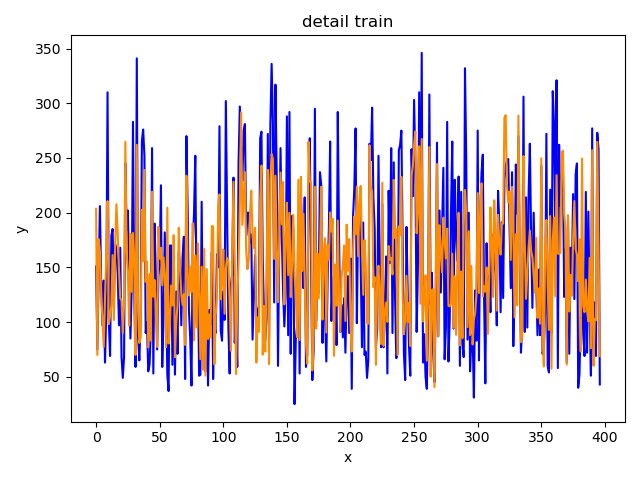
训练集拟合曲线

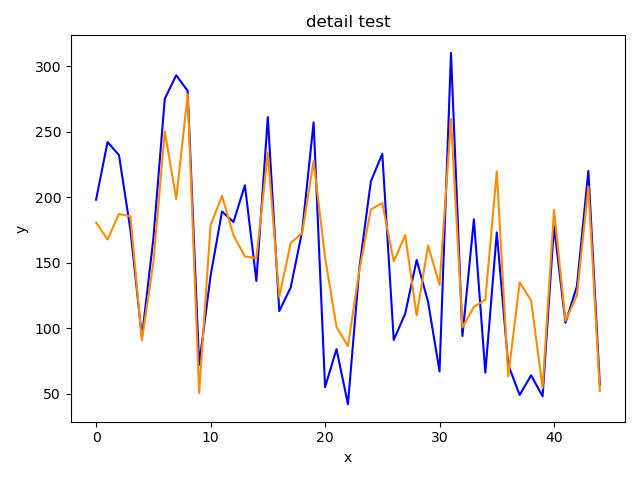
测试集拟合曲线

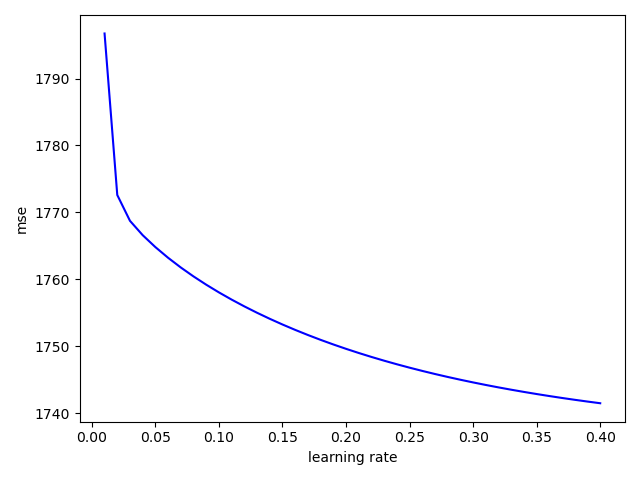
调整学习率优化模型

1
2
3
4
5
6
7
8
9
10
11
12
13
14
15
# 调整学习率优化模型
lr.linear_train(X_train, y_train, 0.4, 100000)
mse_his = []
rates = [i / 100 for i in range(1, 41)]
for learning_rate in rates:
loss, params, grads = lr.linear_train(X_train, y_train, learning_rate, 200000)
y_pred = lr.predict(X_test, params)
mse = np.sum(((y_pred - y_test) ** 2)) / len(X_test) # MSE
mse_his.append(mse)
print(mse_his)
plt.plot(rates, mse_his, color='blue')
plt.xlabel('learning rate')
plt.ylabel('mse')
plt.savefig('learning_rate.jpg')
plt.show()

1669790769334

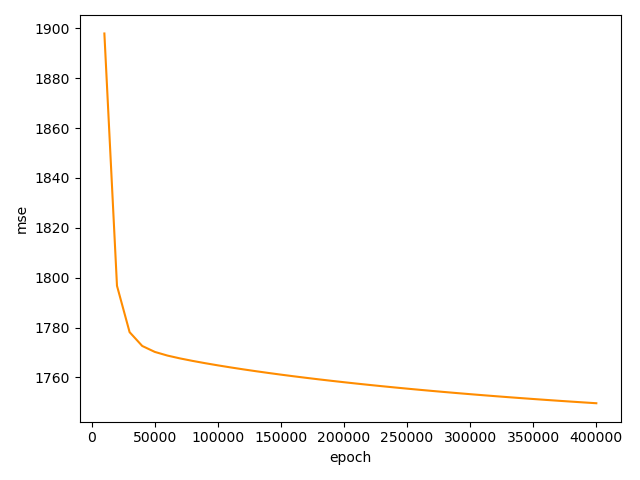
调整模型训练次数优化模型

1
2
3
4
5
6
7
8
9
10
11
12
13
14
# 调整模型训练次数优化模型
mse_his = []
epochs = [i * 10000 for i in range(1, 41)]
for epoch in epochs:
loss, params, grads = lr.linear_train(X_train, y_train, 0.1, epoch)
y_pred = lr.predict(X_test, params)
mse = np.sum(((y_pred - y_test) ** 2)) / len(X_test) # MSE
mse_his.append(mse)
print(mse_his)
plt.plot(epochs, mse_his, color='darkorange')
plt.xlabel('epoch')
plt.ylabel('mse')
plt.savefig('epoch.jpg')
plt.show()

1669791789361

实验二 Logistic Regression

采用 sklearn 设计逻辑回归模型

导入包

1
2
3
4
5
6
import matplotlib.pyplot as plt
import numpy as np
from sklearn import linear_model
from sklearn.datasets import load_breast_cancer
from sklearn.preprocessing import StandardScaler
from sklearn.model_selection import train_test_split

显示数据集前 3 个样本

1
2
3
X = load_breast_cancer().data
labels = load_breast_cancer().target
print('data', X[:3, :], '\n', 'target', labels[:3])
1
2
3
4
5
6
7
8
9
10
11
12
13
14
15
16
data [[1.799e+01 1.038e+01 1.228e+02 1.001e+03 1.184e-01 2.776e-01 3.001e-01
1.471e-01 2.419e-01 7.871e-02 1.095e+00 9.053e-01 8.589e+00 1.534e+02
6.399e-03 4.904e-02 5.373e-02 1.587e-02 3.003e-02 6.193e-03 2.538e+01
1.733e+01 1.846e+02 2.019e+03 1.622e-01 6.656e-01 7.119e-01 2.654e-01
4.601e-01 1.189e-01]
[2.057e+01 1.777e+01 1.329e+02 1.326e+03 8.474e-02 7.864e-02 8.690e-02
7.017e-02 1.812e-01 5.667e-02 5.435e-01 7.339e-01 3.398e+00 7.408e+01
5.225e-03 1.308e-02 1.860e-02 1.340e-02 1.389e-02 3.532e-03 2.499e+01
2.341e+01 1.588e+02 1.956e+03 1.238e-01 1.866e-01 2.416e-01 1.860e-01
2.750e-01 8.902e-02]
[1.969e+01 2.125e+01 1.300e+02 1.203e+03 1.096e-01 1.599e-01 1.974e-01
1.279e-01 2.069e-01 5.999e-02 7.456e-01 7.869e-01 4.585e+00 9.403e+01
6.150e-03 4.006e-02 3.832e-02 2.058e-02 2.250e-02 4.571e-03 2.357e+01
2.553e+01 1.525e+02 1.709e+03 1.444e-01 4.245e-01 4.504e-01 2.430e-01
3.613e-01 8.758e-02]]
target [0 0 0]

调整数据集分割比例并查看分割结果,对数据进行标准化

1
2
3
4
5
6
7
8
9
# 分割数据,标准化数据集
offset = int(X.shape[0] * 0.9)
X_train, y_train = X[:offset], labels[:offset]
X_test, y_test = X[offset:], labels[offset:]
print('X_train', X_train.shape, 'y_train', y_train.shape, 'X_test', X_test.shape, 'y_test', y_test.shape)
sc = StandardScaler()
sc.fit(X_train)
X_train_std = sc.transform(X_train) # 数据标准化
X_test_std = sc.transform(X_test)
1
X_train (512, 30) y_train (512,) X_test (57, 30) y_test (57,)

型训练并评估结果

1
2
3
4
5
6
7
8
9
10
11
model = linear_model.LogisticRegression(penalty='l2', fit_intercept=True, \
intercept_scaling=1, solver='liblinear', \
max_iter=100, multi_class='ovr')
model.fit(X_train_std, y_train)
print('coefficients:', model.coef_, '\n', 'intercept:', model.intercept_) # coefficients系数, intercept截距
acc1 = model.score(X_train_std, y_train)
acc2 = model.score(X_test_std, y_test)
W = model.coef_.reshape(-1)
b = model.intercept_
print('train accuracy is:', acc1)
print('test accuracy is:', acc2)
1
2
3
4
5
6
7
8
coefficients: [[-0.3810934  -0.65420282 -0.37976599 -0.45743451 -0.12937427  0.52064464
-0.67219211 -0.72649327 0.01905227 0.26711084 -1.20265135 0.36255618
-0.73109672 -0.9115291 -0.19108819 0.68556724 0.2042336 -0.44950466
0.26713624 0.48778509 -1.00712835 -1.16788512 -0.86133031 -0.95809183
-0.8148613 0.08182499 -0.72371698 -0.89605559 -0.89464349 -0.49145749]]
intercept: [0.01458037]
train accuracy is: 0.98828125
test accuracy is: 0.9824561403508771

定义绘图函数并画出分类图像

1
2
3
4
5
6
7
8
9
10
11
12
13
14
15
16
17
18
19
20
21
22
23
24
25
26
27
28
29
# 定义绘图函数,并画出分类图像
def plot_LogisticRegression(data, y_data, title): # 预测结果绘制函数
n = data.shape[0]
x1cord1 = []
x2cord1 = []
x1cord0 = []
x2cord0 = []
for i in range(n):
if y_data[i] == 1:
x1cord1.append(data[i][0])
x2cord1.append(data[i][1])
else:
x1cord0.append(data[i][0])
x2cord0.append(data[i][1])
fig = plt.figure()
ax = fig.add_subplot(111)
ax.scatter(x1cord1, x2cord1, s=32, c='red')
ax.scatter(x1cord0, x2cord0, s=32, c='green')
x = np.arange(-5, 5, 0.5)
y = (-b - W[0] * x) / W[1] # 决策边界
ax.plot(x, y)
plt.xlabel('X1')
plt.ylabel('X2')
plt.title(title)
plt.show()


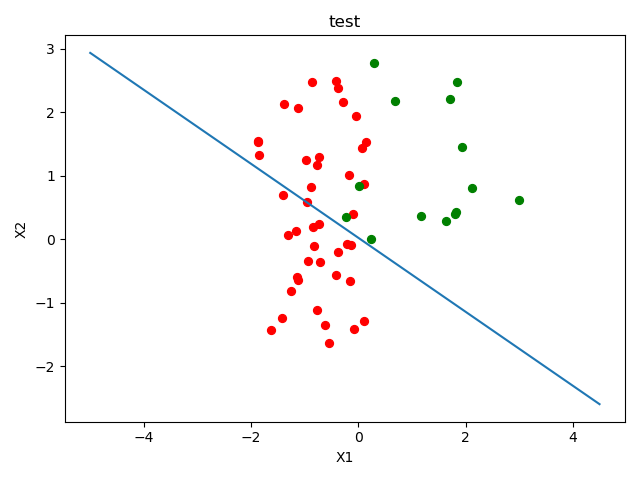
plot_LogisticRegression(X_train_std, y_train, 'train')
plot_LogisticRegression(X_test_std, y_test, 'test')

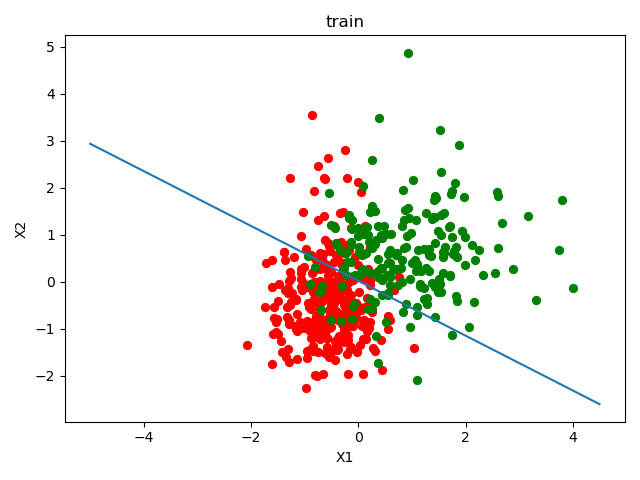
训练集分类结果

测试集分类结果

复现逻辑回归核心代码

导入包

1
2
3
4
5
import numpy as np
import matplotlib.pyplot as plt
from sklearn.datasets import load_breast_cancer
from sklearn.preprocessing import StandardScaler
from sklearn.model_selection import train_test_split

构建 LogisticRegression 类,并在其中定义 sigmoid 函数、模型参数初始化函数 、代价函数、训练函数

1
2
3
4
5
6
7
8
9
10
11
12
13
14
15
16
17
18
19
20
21
22
23
24
25
26
27
class LogisticRegression:
def __init__(self):
pass

def sigmod(self, x):
"""sigmoid函数"""
z = 1 / (1 + np.exp(-x))
return z

def initialize_params(self, dims):
"""初始化模型参数为0"""
W = np.zeros((dims, 1))
b = 0
return W, b

def cost(self, X, y, W, b):
"""定义代价函数"""
num_train = X.shape[0]
num_features = X.shape[1]
f = self.sigmod(np.dot(X, W) + b) # num_train个预测值
cost = -1 / num_train * np.sum(y * np.log(f) + (1 - y) * np.log(1 - f))
dW = np.dot(X.T, (f - y)) / num_train # 求梯度
db = np.sum(f - y) / num_train
cost = np.squeeze(cost) # 删除多维度条目,如[[1,2,3]]变为[1,2,3]
return f, cost, dW, db


定义模型训练函数

1
2
3
4
5
6
7
8
9
10
11
12
13
14
15
16
def fit(self, X, y, learning_rate, epochs):
"""定义模型训练函数"""
W, b = self.initialize_params(X.shape[1]) # 初始化模型参数
cost_list = []
for i in range(epochs):
# 计算训练集当前输出,损失函数值,梯度
f, cost, dW, db = self.cost(X, y, W, b)
cost_list.append(cost)
# 参数更新
W = W - learning_rate * dW
b = b - learning_rate * db
if i % 100 == 0:
print('epoch %d cost %f' % (i, cost))
params = {'W': W, 'b': b}
grads = {'dW': dW, 'db': db}
return cost_list, params, grads

定义模型预测函数和准确率计算函数

1
2
3
4
5
6
7
8
9
10
11
12
13
14
15
16
17
18
19
20
def predict(self, X, params):
"""模型测试函数"""
W = params['W']
b = params['b']
y_pred = self.sigmod(np.dot(X, W) + b)
for i in range(len(y_pred)):
if y_pred[i] > 0.5:
y_pred[i] = 1
else:
y_pred[i] = 0
return y_pred

def score(self, y_test, y_pred):
"""计算分类准确率"""
correct_count = 0
for i in range(len(y_test)):
if y_test[i] == y_pred[i]:
correct_count += 1
acc = correct_count / len(y_test)
return acc

定义绘图函数

1
2
3
4
5
6
7
8
9
10
11
12
13
14
15
16
17
18
19
20
21
22
23
24
25
26
def plot_LogisticRegression(self, X_train, y_train, params, title):
"""可视化分类结果"""
n = X_train.shape[0]
xcord1 = []
ycord1 = []
xcord2 = []
ycord2 = []
for i in range(n): # 取前两个特征可视化
if y_train[i] == 1:
xcord1.append(X_train[i][0])
ycord1.append(X_train[i][1])
else:
xcord2.append(X_train[i][0])
ycord2.append(X_train[i][1])
fig = plt.figure()
ax = fig.add_subplot(111)
ax.scatter(xcord1, ycord1, s=32, c='red')
ax.scatter(xcord2, ycord2, s=32, c='green')
x = np.arange(-5, 5, 0.5)
y = (-params['b'] - params['W'][0] * x) / params['W'][1]
ax.plot(x, y)
plt.xlabel('X1')
plt.ylabel('X2')
plt.title(title)
plt.savefig(f'detail_{title}.jpg')
plt.show()

测试模型并展示代价曲线

1
2
3
4
5
6
7
8
9
10
11
12
13
14
15
16
17
18
19
20
21
22
if __name__ == '__main__':
# 训练模型并展示代价曲线
model = LogisticRegression()
X = load_breast_cancer().data
labels = load_breast_cancer().target
labels = labels.reshape((-1, 1))
offset = int(X.shape[0] * 0.9)
X_train, y_train = X[:offset], labels[:offset]
X_test, y_test = X[offset:], labels[offset:]
sc = StandardScaler()
sc.fit(X_train)
# 标准化数据
X_train_std = sc.transform(X_train)
X_test_std = sc.transform(X_test)
print(X_train.shape, y_train.shape, X_test.shape, y_test.shape)
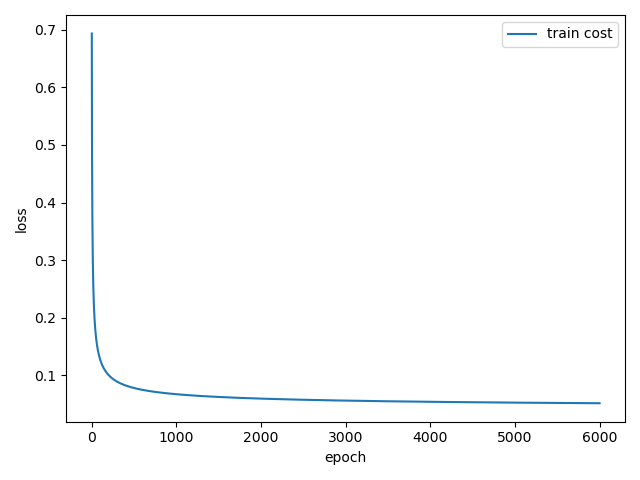
cost_list, params, grads = model.fit(X_train_std, y_train, 0.05, 6000)
plt.plot(cost_list)
plt.legend(['train cost'])
plt.xlabel('epoch')
plt.ylabel('loss')
plt.savefig('train_cost.jpg')
plt.show()

代价曲线

测试模型并展示分类图像

1
2
3
4
5
6
7
8
9
10
# 测试模型并展示分类图像
y_train_pred = model.predict(X_train_std, params)
accuracy_score_train = model.score(y_train, y_train_pred)
print('detail')
print('train accuracy is:', accuracy_score_train)
y_test_pred = model.predict(X_test_std, params)
accuracy_score_test = model.score(y_test, y_test_pred)
print('test accuracy is:', accuracy_score_test)
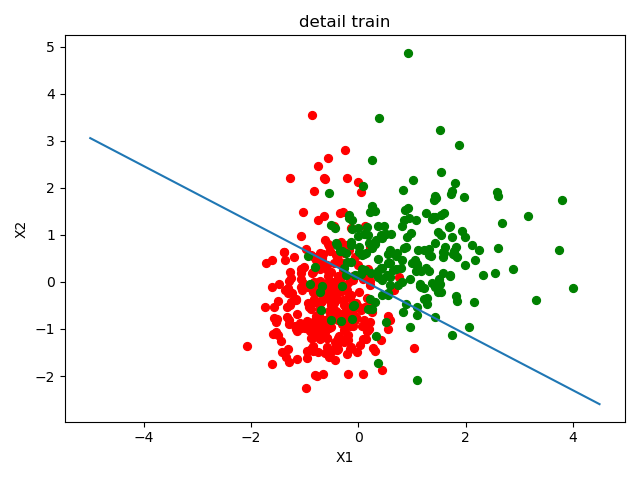
model.plot_LogisticRegression(X_train_std, y_train, params, 'detail train')
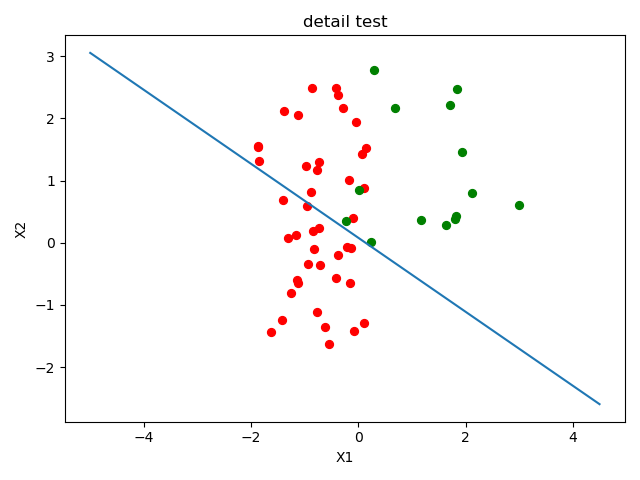
model.plot_LogisticRegression(X_test_std, y_test, params, 'detail test')

训练集分类结果

测试集分类结果

调整学习率优化模型

1
2
3
4
5
6
7
8
9
10
11
12
13
14
# 调整学习率优化模型
acc = []
lr_his = []
for i in range(1,21):
learning_rate = 0.0005*i
lr_his.append(learning_rate)
cost_list, params, grads = model.fit(X_train_std, y_train, learning_rate, 6000)
y_train_pred = model.predict(X_train_std, params)
accuracy_score_train = model.score(y_train, y_train_pred)
acc.append(accuracy_score_train)
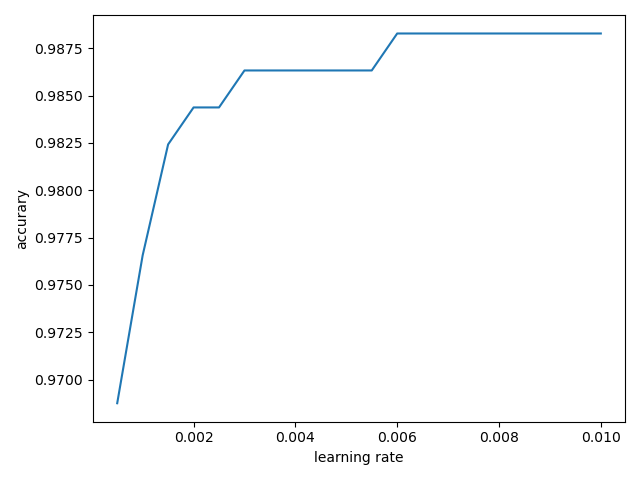
plt.plot(lr_his, acc)
plt.xlabel('learning rate')
plt.ylabel('accurary')
plt.show()

学习曲线

调整训练次数优化模型

1
2
3
4
5
6
7
8
9
10
11
12
13
14
# 调整模型训练次数优化模型
acc = []
epoch_his = []
for i in range(1, 21):
epoch = 500 * i
epoch_his.append(epoch)
cost_list, params, grads = model.fit(X_train_std, y_train, 0.01, epoch)
y_train_pred = model.predict(X_train_std, params)
accuracy_score_train = model.score(y_train, y_train_pred)
acc.append(accuracy_score_train)
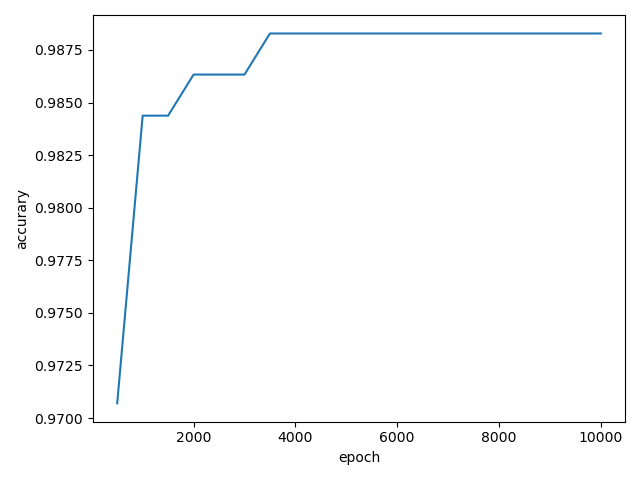
plt.plot(epoch_his, acc)
plt.xlabel('epoch')
plt.ylabel('accurary')
plt.show()

训练次数曲线

实验七 Neural Network

采用 keras 设计神经网络模型

导入包

1
2
import tensorflow.keras as keras
import matplotlib.pyplot as plt

读取数据集并展示读取结果

1
2
3
4
5
(train_data, train_labels), (test_data, test_labels) = keras.datasets.mnist.load_data()
print('train data', train_data.shape)
print('train labels', train_labels.shape)
print('test data', test_data.shape)
print('test labels', test_labels.shape)
1
2
3
4
train data (60000, 28, 28)
train labels (60000,)
test data (10000, 28, 28)
test labels (10000,)

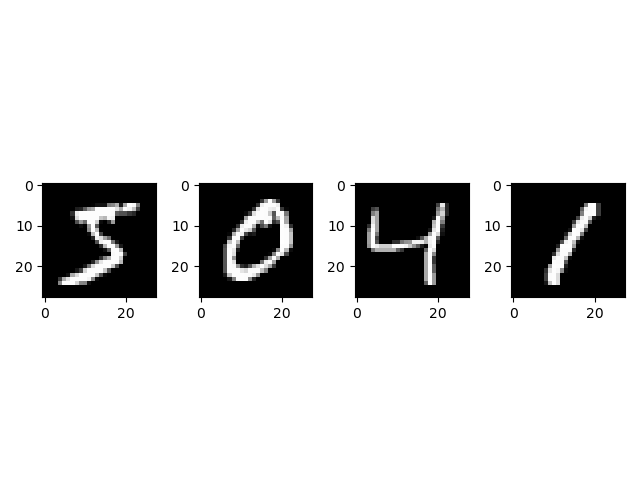
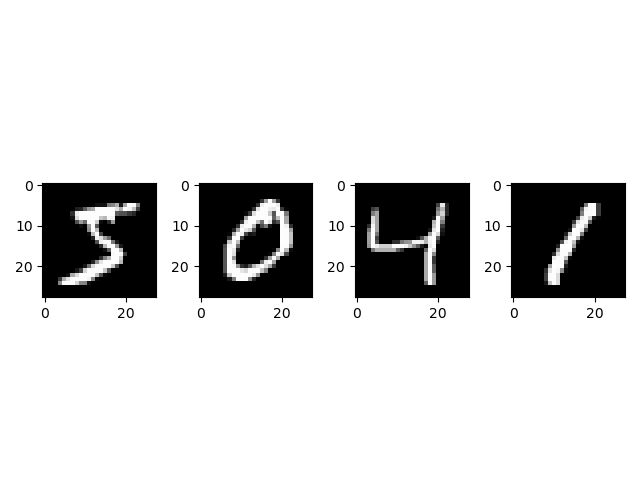
调用imshow方法,打印训练集前四个样本

1
2
3
4
5
6
7
8
9
10
plt.subplot(1, 4, 1)
plt.imshow(train_data[0], cmap='gray')
plt.subplot(1, 4, 2)
plt.imshow(train_data[1], cmap='gray')
plt.subplot(1, 4, 3)
plt.imshow(train_data[2], cmap='gray')
plt.subplot(1, 4, 4)
plt.imshow(train_data[3], cmap='gray')
# plt.imshow()函数负责对图像进行处理,并显示其格式,而plt.show()则是将plt.imshow()处理后的函数显示出来
plt.show()

前四个样本

训练模型并评估结果

1
2
3
4
5
6
7
8
9
10
11
12
13
model = keras.Sequential([
keras.layers.Flatten(input_shape=[28, 28, 1]),
keras.layers.Dense(64, activation='relu'),
keras.layers.Dense(10, activation='softmax'),
])
model.summary() # 输出模型各层的参数状况
model.compile(optimizer=keras.optimizers.Adam(learning_rate=0.001), \
loss=keras.losses.sparse_categorical_crossentropy, \
metrics=['accuracy'])
train_data = train_data / 255 # 转化为01矩阵
history = model.fit(train_data.reshape(-1, 28, 28, 1), train_labels, epochs=5) # reshape(-1, 28, 28, 1)转换为1列
acc = model.evaluate(test_data.reshape(-1, 28, 28, 1), test_labels)
print('test accuracy:', acc[1])
1
2
3
4
5
6
7
8
9
10
11
12
13
14
15
16
17
18
19
20
21
22
23
24
25
26
27
Model: "sequential"
_________________________________________________________________
Layer (type) Output Shape Param #
=================================================================
flatten (Flatten) (None, 784) 0

dense (Dense) (None, 64) 50240

dense_1 (Dense) (None, 10) 650

=================================================================
Total params: 50,890
Trainable params: 50,890
Non-trainable params: 0
_________________________________________________________________
Epoch 1/5
1875/1875 [==============================] - 9s 3ms/step - loss: 0.2990 - accuracy: 0.9155
Epoch 2/5
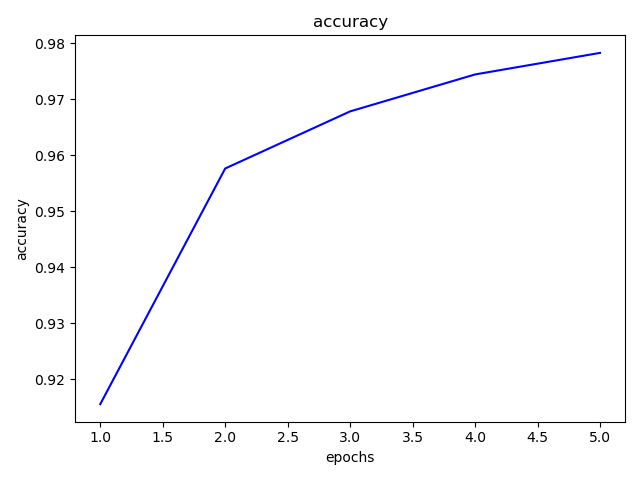
1875/1875 [==============================] - 5s 3ms/step - loss: 0.1446 - accuracy: 0.9576
Epoch 3/5
1875/1875 [==============================] - 6s 3ms/step - loss: 0.1073 - accuracy: 0.9678
Epoch 4/5
1875/1875 [==============================] - 6s 3ms/step - loss: 0.0847 - accuracy: 0.9744
Epoch 5/5
1875/1875 [==============================] - 6s 3ms/step - loss: 0.0709 - accuracy: 0.9783
313/313 [==============================] - 1s 3ms/step - loss: 16.2302 - accuracy: 0.9686
test accuracy: 0.9685999751091003

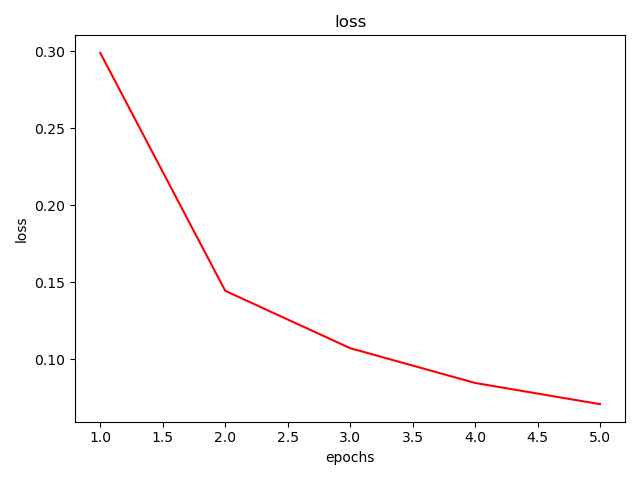
画出模型训练误差和训练准确率

1
2
3
4
5
6
7
8
9
10
11
12
13
14
epochs = [i for i in range(1,6)]
plt.title('loss')
plt.xlabel('epochs')
plt.ylabel('loss')
plt.plot(epochs, history.history['loss'], 'r')
plt.savefig('loss.jpg')
plt.show()

plt.title('accuracy')
plt.xlabel('epochs')
plt.ylabel('accuracy')
plt.plot(epochs, history.history['accuracy'], 'b')
plt.savefig('accuracy.jpg')
plt.show()

模型损失

模式精度

复现神经网络核心代码

1
2
3
4
5
6
7
8
9
10
11
12
13
14
15
16
17
18
19
20
21
22
23
24
25
26
27
28
29
30
31
32
33
34
35
36
37
38
39
40
41
42
43
44
45
46
47
48
49
50
51
52
53
54
55
56
57
58
59
60
61
62
63
64
65
66
67
68
69
70
71
72
73
74
75
76
77
78
79
80
81
82
83
84
85
86
87
88
89
90
91
92
93
import tensorflow.compat.v1 as tf
import matplotlib.pyplot as plt

tf.disable_eager_execution()

# 读取数据集并展示读取结果
(train_data, train_labels), (test_data, test_labels) = tf.keras.datasets.mnist.load_data()
train_y = tf.keras.utils.to_categorical(train_labels)
test_y = tf.keras.utils.to_categorical(test_labels)
train_data = train_data / 255
test_data = test_data / 255
print('train data', train_data.shape)
print('train label', train_labels.shape)
print('test data', test_data.shape)
print('test label', test_labels.shape)

# 定义模型各项参数
learning_rate = 0.2
BATCH_SIZE = 32
EPOCH = 20
train_losses = []
test_losses = []
train_accuracies = []
test_accuracies = []
batch = len(train_labels)// BATCH_SIZE
batch_test = len(test_labels) // BATCH_SIZE
lr = tf.placeholder(tf.float32)
x_data = tf.placeholder(tf.float32, [None, 784], name='X')
y_data = tf.placeholder(tf.float32, [None, 10], name='Y')
w1 = tf.Variable(tf.random_normal([784, 64]), name='w1')
w2 = tf.Variable(tf.random_normal([64, 10]), name='w2')
b1 = tf.Variable(tf.random_uniform([64]), name='b1')
b2 = tf.Variable(tf.random_uniform([10]), name='b2')

# 搭建神经网络模型,定义损失函数,优化器,搭建模型计算图
out = tf.nn.relu(tf.add(tf.matmul(x_data, w1), b1))
y_pred = tf.add(tf.matmul(out, w2), b2)
loss = tf.reduce_mean(tf.nn.softmax_cross_entropy_with_logits(labels=y_data, logits=y_pred))
optimizer = tf.train.AdagradOptimizer(learning_rate=lr).minimize(loss)
accuracy = tf.reduce_mean(tf.cast(tf.equal(tf.argmax(y_pred, 1),
tf.argmax(y_data, 1)), "float"))
init = tf.global_variables_initializer()

# 训练神经网络并评估其效果
with tf.Session() as sess:
sess.run(init)
for epoch in range(EPOCH):
test_loss = 0
train_loss = 0
test_acc = 0
train_acc = 0
for now_batch in range(batch):
X = train_data[now_batch * BATCH_SIZE: (now_batch + 1) * BATCH_SIZE].reshape(BATCH_SIZE, -1)
Y = train_y[now_batch * BATCH_SIZE: (now_batch + 1) * BATCH_SIZE]
sess.run(optimizer, feed_dict={x_data: X, y_data: Y, lr:learning_rate})
for now_batch in range(batch):
X = train_data[now_batch * BATCH_SIZE: (now_batch + 1) * BATCH_SIZE].reshape(BATCH_SIZE, -1)
Y = train_y[now_batch * BATCH_SIZE: (now_batch + 1) * BATCH_SIZE]
loss_, acc = sess.run([loss, accuracy], feed_dict={x_data: X, y_data: Y})
train_loss += loss_
train_acc += acc
train_loss /= batch
train_acc /= batch
print('now epoch: {}, loss: {}, acc:{}'.format(epoch, train_loss, train_acc))
for now_batch in range(batch_test):
X = test_data[now_batch * BATCH_SIZE: (now_batch + 1) * BATCH_SIZE].reshape(BATCH_SIZE, -1)
Y = test_y[now_batch * BATCH_SIZE: (now_batch + 1) * BATCH_SIZE]
loss_, acc = sess.run([loss, accuracy], feed_dict={x_data: X, y_data: Y})
test_loss += loss_
test_acc += acc
test_loss /= batch_test
test_acc /= batch_test
train_losses.append(train_loss)
test_losses.append(test_loss)
train_accuracies.append(train_acc)
test_accuracies.append(test_acc)
print('test acc: {}'.format(test_accuracies[-1]))

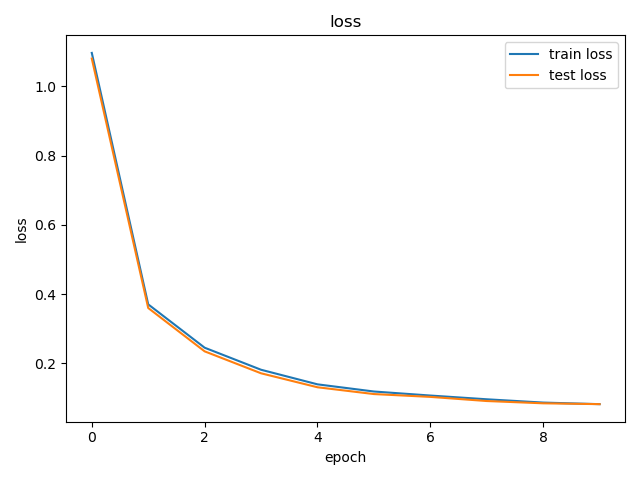
# 绘制神经网络评估曲线
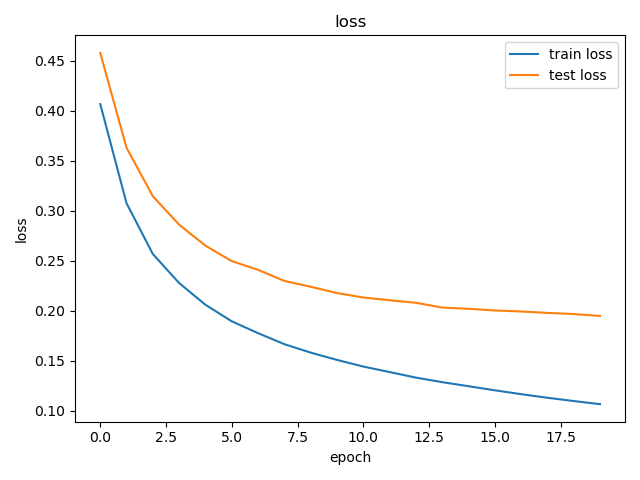
plt.title('loss')
plt.xlabel('epoch')
plt.ylabel('loss')
plt.plot(train_losses)
plt.plot(test_losses)
plt.legend(['train loss', 'test loss'])
plt.show()
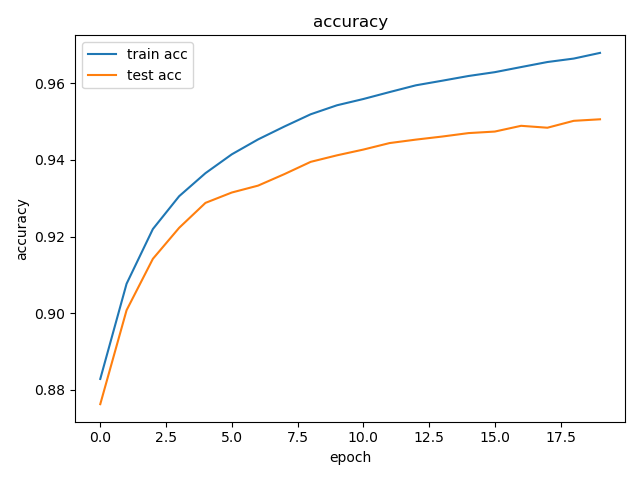
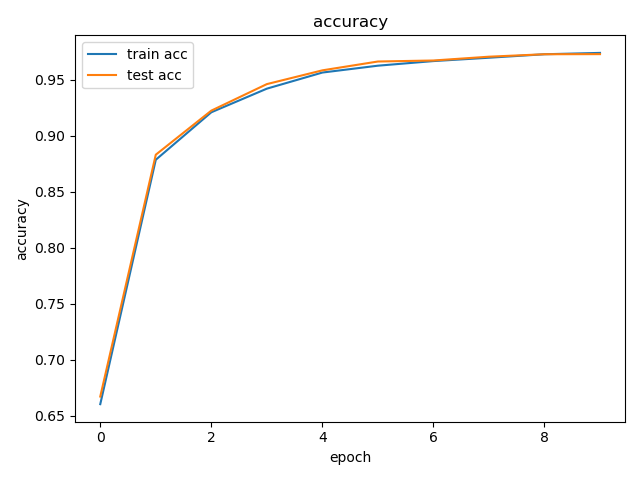
plt.title('accuracy')
plt.xlabel('epoch')
plt.ylabel('accuracy')
plt.plot(train_accuracies)
plt.plot(test_accuracies)
plt.legend(['train acc', 'test acc'])
plt.show()

模型损失

模型精度

实验八 CNN

采用 keras 设计CNN网络模型

导入包

1
2
3
from tensorflow import keras
import tensorflow as tf
import matplotlib.pyplot as plt

读取数据集,调用print方法查看分割结果

1
2
3
(train_data, train_labels), (test_data, test_labels) = keras.datasets.mnist.load_data()
print(train_data.shape)
print(train_labels.shape)
1
2
(60000, 28, 28)
(60000,)

显示训练集前 4 个样本

1
2
3
4
5
6
7
8
9
plt.subplot(1, 4, 1)
plt.imshow(train_data[0], cmap='gray')
plt.subplot(1, 4, 2)
plt.imshow(train_data[1], cmap='gray')
plt.subplot(1, 4, 3)
plt.imshow(train_data[2], cmap='gray')
plt.subplot(1, 4, 4)
plt.imshow(train_data[3], cmap='gray')
plt.show()

前四个样本

通过调用 compile 方法搭建模型,调用 fit()方法训练模型,展示模型训练后的测试集准确率

1
2
3
4
5
6
7
8
9
10
11
12
13
14
15
16
17
18
19
# 通过调用 compile 方法搭建模型,调用 fit()方法训练模型,展示模型训练后的测试集准确率
model = keras.Sequential([
keras.layers.Conv2D(64, (3, 3), activation='relu', input_shape=[28, 28, 1]),
keras.layers.MaxPooling2D(2, 2),
keras.layers.Conv2D(64, (3, 3), activation='relu', input_shape=[28, 28, 1]),
keras.layers.MaxPooling2D(2, 2),
keras.layers.Flatten(),
keras.layers.Dense(10, activation='softmax')
])
model.summary() # 输出模型各层的参数状况
model.compile(optimizer='adam',
loss=tf.losses.sparse_categorical_crossentropy,
metrics=['accuracy'])

train_data = train_data / 255
history = model.fit(train_data.reshape(-1, 28, 28, 1), train_labels, epochs=5)
test_data = test_data / 255
acc = model.evaluate(test_data.reshape(-1, 28, 28, 1), test_labels)
print('test accuracy:', acc[1])
1
2
3
4
5
6
7
8
9
10
11
12
13
14
15
16
17
18
19
20
21
22
23
Model: "sequential"
_________________________________________________________________
Layer (type) Output Shape Param #
=================================================================
conv2d (Conv2D) (None, 26, 26, 64) 640

max_pooling2d (MaxPooling2D (None, 13, 13, 64) 0
)

conv2d_1 (Conv2D) (None, 11, 11, 64) 36928

max_pooling2d_1 (MaxPooling (None, 5, 5, 64) 0
2D)

flatten (Flatten) (None, 1600) 0

dense (Dense) (None, 10) 16010

=================================================================
Total params: 53,578
Trainable params: 53,578
Non-trainable params: 0
_________________________________________________________________

画出模型训练误差和训练准确率

1
2
3
4
5
6
7
8
9
10
11
epoch = [i for i in range(5)]
plt.title('loss')
plt.xlabel('epoch')
plt.ylabel('loss')
plt.plot(epoch, history.history['loss'], 'r')
plt.show()
plt.title('accuracy')
plt.xlabel('epoch')
plt.ylabel('accuracy')
plt.plot(epoch, history.history['accuracy'], 'b')
plt.show()

复现CNN核心代码

1
2
3
4
5
6
7
8
9
10
11
12
13
14
15
16
17
18
19
20
21
22
23
24
25
26
27
28
29
30
31
32
33
34
35
36
37
38
39
40
41
42
43
44
45
46
47
48
49
50
51
52
53
54
55
56
57
58
59
60
61
62
63
64
65
66
67
68
69
70
71
72
73
74
75
76
77
78
79
80
81
82
83
84
85
86
87
88
89
90
91
92
93
94
95
96
97
98
99
100
101
102
103
104
105
106
107
108
109
110
111
112
113
114
115
116
117
118
119
120
121
122
123
124
125
126
127
128
129
130
131
132
133
134
135
136
137
138
139
140
141
142
143
144
145
146
147
148
149
150
151
152
153
154
155
156
157
158
159
160
161
162
163
164
165
166
167
168
169
170
171
172
173
174
175
176
177
178
179
180
181
182
183
184
185
186
187
188
189
190
191
192
193
194
195
196
197
198
199
200
201
202
203
204
205
206
207
208
209
210
211
212
213
214
215
216
217
218
219
220
221
222
223
224
225
226
227
228
229
230
231
232
233
234
import tensorflow.compat.v1 as tf
import numpy as np
import matplotlib.pyplot as plt

tf.disable_eager_execution()

# 读取数据集并展示读取结果
(train_data, train_labels), (test_data, test_labels) = tf.keras.datasets.mnist.load_data()
train_y = tf.keras.utils.to_categorical(train_labels)
test_y = tf.keras.utils.to_categorical(test_labels)
train_data = train_data / 255
test_data = test_data / 255
print('train data', train_data.shape)
print('train label', train_labels.shape)
print('test data', test_data.shape)
print('test label', test_labels.shape)

# 通过调用 imshow 方法,展示了训练集的前 4 个数据
plt.subplot(1, 4, 1)
plt.imshow(train_data[0], cmap='gray')
plt.subplot(1, 4, 2)
plt.imshow(train_data[1], cmap='gray')
plt.subplot(1, 4, 3)
plt.imshow(train_data[2], cmap='gray')
plt.subplot(1, 4, 4)
plt.imshow(train_data[3], cmap='gray')
plt.show()

# 定义搭建模型所需要的各项参数,包括学习率,抽样大小,训练次数,神经网络的输入等等。
LEARNING_RATE = 0.01
BATCH_SIZE = 100
EPOCH = 10
train_losses = []
test_losses = []
train_accuracies = []
test_accuracies = []
batch = len(train_labels)// BATCH_SIZE
batch_test = len(test_labels) // BATCH_SIZE

# 定义参数初始化方法并初始化模型参数
def get_weight(name, shape, gain=np.sqrt(2)):
total = np.prod(shape)
init_std = gain / np.sqrt(total)
init = tf.initializers.random_normal(0, init_std)
return tf.get_variable(name, shape=shape, initializer=init)

# 定义模型的计算过程,定义损失函数为交叉熵函数,优化器选择Adagrad 优化器。
with tf.device('/cpu:0'):
x = tf.placeholder(tf.float32, [None, 28, 28])
x_data = tf.reshape(x, [-1, 28, 28, 1])
y_data = tf.placeholder(tf.float32, [None, 10])
lr = tf.placeholder(tf.float32)
bc1 = tf.Variable(tf.truncated_normal([32]))
bc2 = tf.Variable(tf.truncated_normal([64]))
b_fc = tf.Variable(tf.truncated_normal([512]))
b1 = tf.Variable(tf.truncated_normal([10]))
wc1 = get_weight('wc1', [3, 3, 1, 32])
wc2 = get_weight('wc2', [3, 3, 32, 64])
w_fc = get_weight('w_fc', [1600, 512])
w1 = get_weight('w1', [512, 10])

with tf.device('/cpu:0'):
out1 = tf.nn.relu(tf.nn.bias_add(tf.nn.conv2d(x_data, wc1, strides=[1, 1, 1, 1], padding='VALID'), bc1))
out2 = tf.nn.max_pool(out1, ksize=[1, 2, 2, 1], strides=[1, 2, 2, 1], padding='VALID')
out3 = tf.nn.relu(tf.nn.bias_add(tf.nn.conv2d(out2, wc2, strides=[1, 1, 1, 1], padding='VALID'), bc2))
out4 = tf.nn.max_pool(out3, ksize=[1, 2, 2, 1], strides=[1, 2, 2, 1], padding='VALID')
out5 = tf.reshape(out4, shape=[BATCH_SIZE, -1])
out6 = tf.nn.relu(tf.matmul(out5, w_fc)+b_fc)
out7 = tf.nn.dropout(out6, keep_prob=0.8)
y_pred = tf.matmul(out7, w1)+b1

loss = tf.reduce_mean(tf.nn.softmax_cross_entropy_with_logits(labels=y_data, logits=y_pred))
optimizer = tf.train.AdagradOptimizer(learning_rate=lr).minimize(loss)
accuracy = tf.reduce_mean(tf.cast(tf.equal(tf.argmax(y_pred, 1), tf.argmax(y_data, 1)), "float"))

init = tf.global_variables_initializer()

# 训练深度学习模型并评估结果
with tf.Session() as sess:
sess.run(init)
for epoch in range(EPOCH):
test_loss = 0
train_loss = 0
test_acc = 0
train_acc = 0
for now_batch in range(batch):
X = train_data[now_batch * BATCH_SIZE: (now_batch + 1) * BATCH_SIZE]
Y = train_y[now_batch * BATCH_SIZE: (now_batch + 1) * BATCH_SIZE]
sess.run(optimizer, feed_dict={x: X, y_data: Y, lr:LEARNING_RATE })
for now_batch in range(batch):
X = train_data[now_batch * BATCH_SIZE: (now_batch + 1) * BATCH_SIZE]
Y = train_y[now_batch * BATCH_SIZE: (now_batch + 1) * BATCH_SIZE]
loss_, acc = sess.run([loss, accuracy], feed_dict={x: X, y_data: Y})
train_loss += loss_
train_acc += acc
train_loss /= batch
train_acc /= batch
for now_batch in range(batch_test):
X = test_data[now_batch * BATCH_SIZE: (now_batch + 1) * BATCH_SIZE]
Y = test_y[now_batch * BATCH_SIZE: (now_batch + 1) * BATCH_SIZE]
loss_, acc = sess.run([loss, accuracy], feed_dict={x: X, y_data: Y})
test_loss += loss_
test_acc += acc
test_loss /= batch_test
test_acc /= batch_test
print('now epoch: {}, loss: {}, acc:{}'.format(epoch, test_loss, test_acc))
train_losses.append(train_loss)
test_losses.append(test_loss)
train_accuracies.append(train_acc)
test_accuracies.append(test_acc)

# 绘制模型评估曲线
plt.title('loss')
plt.xlabel('epoch')
plt.ylabel('loss')
plt.plot(train_losses)
plt.plot(test_losses)
plt.legend(['train loss', 'test loss'])
plt.show()
plt.title('accuracy')
plt.xlabel('epoch')
plt.ylabel('accuracy')
plt.plot(train_accuracies)
plt.plot(test_accuracies)
plt.legend(['train acc', 'test acc'])
plt.show()


(train_data, train_labels), (test_data, test_labels) = tf.keras.datasets.mnist.load_data()
train_y = tf.keras.utils.to_categorical(train_labels)
test_y = tf.keras.utils.to_categorical(test_labels)
train_data = train_data / 255
test_data = test_data / 255

BATCH_SIZE = 100
LEARNING_RATE = 0.01
EPOCH = 5
train_losses = []
test_losses = []
train_accuracies = []
test_accuracies = []
batch = len(train_labels)// BATCH_SIZE
batch_test = len(test_labels) // BATCH_SIZE

def get_weight(name, shape, gain=np.sqrt(2)):
total = np.prod(shape)
init_std = gain / np.sqrt(total)
init = tf.initializers.random_normal(0, init_std)
return tf.get_variable(name, shape=shape, initializer=init)

with tf.device('/cpu:0'):
x = tf.placeholder(tf.float32, [None, 28, 28])
x_data = tf.reshape(x, [-1, 28, 28, 1])
y_data = tf.placeholder(tf.float32, [None, 10])
lr = tf.placeholder(tf.float32)

bc1 = tf.Variable(tf.truncated_normal([32]))
bc2 = tf.Variable(tf.truncated_normal([64]))
b_fc = tf.Variable(tf.truncated_normal([512]))
b1 = tf.Variable(tf.truncated_normal([10]))
wc1 = get_weight('wc1', [3, 3, 1, 32])
wc2 = get_weight('wc2', [3, 3, 32, 64])
w_fc = get_weight('w_fc', [1600, 512])
w1 = get_weight('w1', [512, 10])

with tf.device('/cpu:0'):
out1 = tf.nn.relu(tf.nn.bias_add(tf.nn.conv2d(x_data, wc1, strides=[1, 1, 1, 1], padding='VALID'), bc1))
out2 = tf.nn.max_pool(out1, ksize=[1, 2, 2, 1], strides=[1, 2, 2, 1], padding='VALID')
out3 = tf.nn.relu(tf.nn.bias_add(tf.nn.conv2d(out2, wc2, strides=[1, 1, 1, 1], padding='VALID'), bc2))
out4 = tf.nn.max_pool(out3, ksize=[1, 2, 2, 1], strides=[1, 2, 2, 1], padding='VALID')
out5 = tf.reshape(out4, shape=[BATCH_SIZE, -1])
out6 = tf.nn.relu(tf.matmul(out5, w_fc)+b_fc)
out7 = tf.nn.dropout(out6, keep_prob=0.8)
y_pred = tf.matmul(out7, w1)+b1

loss = tf.reduce_mean(tf.nn.softmax_cross_entropy_with_logits(labels=y_data, logits=y_pred))
optimizer = tf.train.AdagradOptimizer(learning_rate=lr).minimize(loss)
accuracy = tf.reduce_mean(tf.cast(tf.equal(tf.argmax(y_pred, 1), tf.argmax(y_data, 1)), "float"))

init = tf.global_variables_initializer()

lr_his = []
lr_acc = []
for i in range(1,11):
LEARNING_RATE = 0.005*i
with tf.Session() as sess:
sess.run(init)
for epoch in range(EPOCH):
test_acc = 0
for now_batch in range(batch):
X = train_data[now_batch * BATCH_SIZE: (now_batch + 1) * BATCH_SIZE]
Y = train_y[now_batch * BATCH_SIZE: (now_batch + 1) * BATCH_SIZE]
sess.run(optimizer, feed_dict={x: X, y_data: Y, lr:LEARNING_RATE})
for now_batch in range(batch_test):
X = test_data[now_batch * BATCH_SIZE: (now_batch + 1) * BATCH_SIZE]
Y = test_y[now_batch * BATCH_SIZE: (now_batch + 1) * BATCH_SIZE]
loss_, acc = sess.run([loss, accuracy], feed_dict={x: X, y_data: Y})
test_acc += acc
test_acc /= batch_test
test_accuracies.append(test_acc)
lr_acc.append(test_accuracies[-1])
lr_his.append(LEARNING_RATE)
plt.title('accuracy')
plt.xlabel('leraning rate')
plt.ylabel('accuracy')
plt.plot(lr_his,lr_acc)
plt.show()

ep_acc = []
ep_his = []
for i in range(1,11):
EPOCH = i
with tf.Session() as sess:
sess.run(init)
for epoch in range(EPOCH):
test_acc = 0
for now_batch in range(batch):
X = train_data[now_batch * BATCH_SIZE: (now_batch + 1) * BATCH_SIZE].reshape(BATCH_SIZE, -1)
Y = train_y[now_batch * BATCH_SIZE: (now_batch + 1) * BATCH_SIZE]
sess.run(optimizer, feed_dict={x_data: X, y_data: Y, lr: LEARNING_RATE})
for now_batch in range(batch_test):
X = test_data[now_batch * BATCH_SIZE: (now_batch + 1) * BATCH_SIZE].reshape(BATCH_SIZE, -1)
Y = test_y[now_batch * BATCH_SIZE: (now_batch + 1) * BATCH_SIZE]
loss_, acc = sess.run([loss, accuracy], feed_dict={x_data: X, y_data: Y})
test_acc += acc
test_acc /= batch_test
test_accuracies.append(test_acc)
ep_acc.append(test_accuracies[-1])
ep_his.append(EPOCH)
plt.title('accuracy')
plt.xlabel('epoch')
plt.ylabel('accuracy')
plt.plot(ep_his, ep_acc)
plt.show()

1670039324632

1670039330113